

In continuation of the Wazir Textile Index (WTI), discussed below is the Wazir Textile Index comprising cumulative financial performance of the top Indian textile companies along with an update on the market performance of Indian textile sector for the first half of FY19.
WTI Sales was calculated to be 121.1 in the first half of FY19 (Base year H1 FY16=100), growing significantly by 10% as compared to H1 FY18. The WTI EBITDA was calculated to be 96.3 in H1 FY19. EBITDA margins have witnessed an impressive growth of 19% in H1 FY19 as compared to H1 FY18. The WTI Cost for raw material (RM), manpower and others were 126.8, 135.2 & 125.1, respectively, in H1 FY19. WTI costs have increased by ~5-15% this half year, as compared to the same period last year.
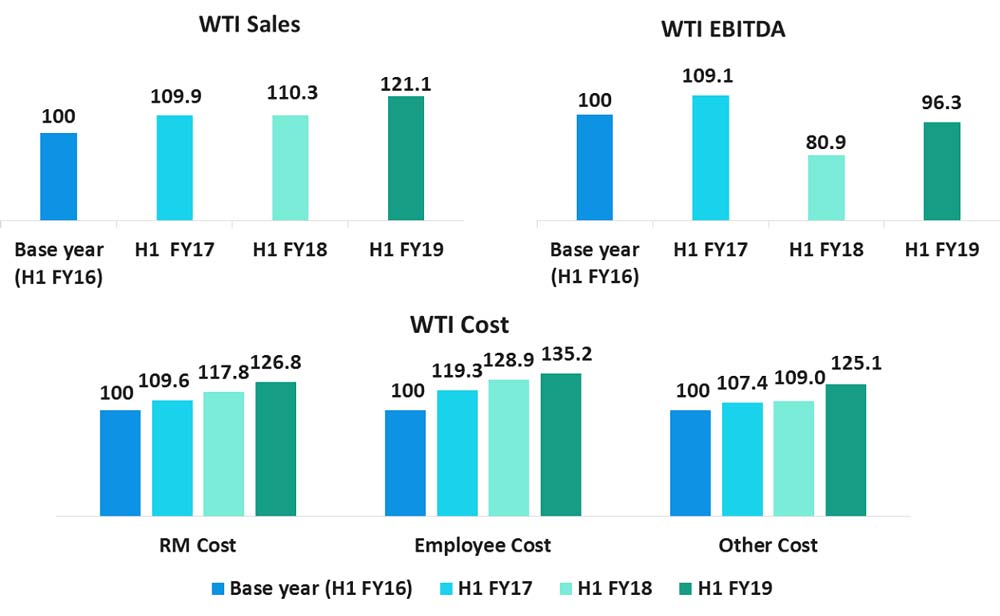
The consolidated sales of the top 10 selected companies were Rs. 21,272 Cr. in H1 FY19 as compared to Rs. 19,378 Cr. in H1 FY18, growing by 10% y-o-y. As compared to H1 FY18, average EBITDA margin increased by 1.1 percentage points to reach 13.8% in H1 FY19. Consolidated RM cost constituted 52.3% of sales in H1 FY19, while consolidated manpower cost constituted 10.2% of sales. Raw material and manpower cost, as a percentage of sales have remained almost stagnant during H1 FY19 as compared to H1 FY18. This reflects in the growing profitability of the top Indian textile companies.
In H1 FY19, India’s Real Gross Domestic Product (GDP) increased from Rs. 62.91 lakh crore to Rs. 67.72 lakh crore from H1 FY18, witnessing a growth of 7.1%.
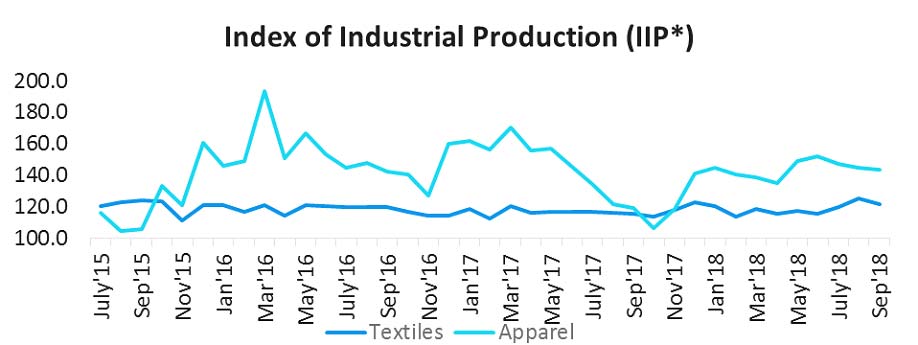
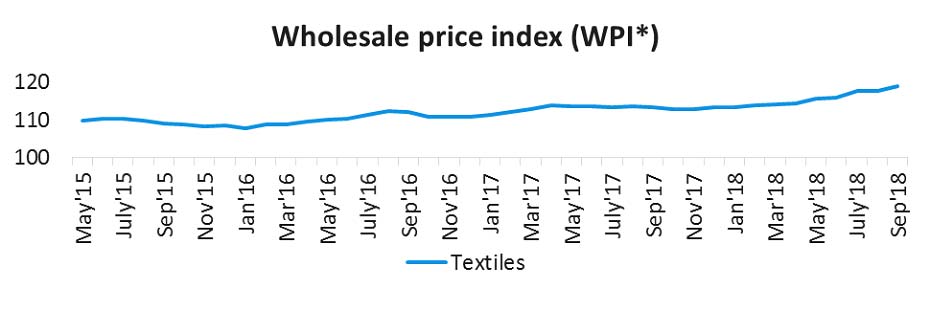
*Base Year 2011-12
Average Index of Industrial Production (IIP) for textiles and apparel increased by 2% and 5% respectively in H1 FY19 compared to H1 FY18. The Wholesale Price Index (WPI) for textiles registered an increase of 3% in H1 FY19, indicating increase in prices.
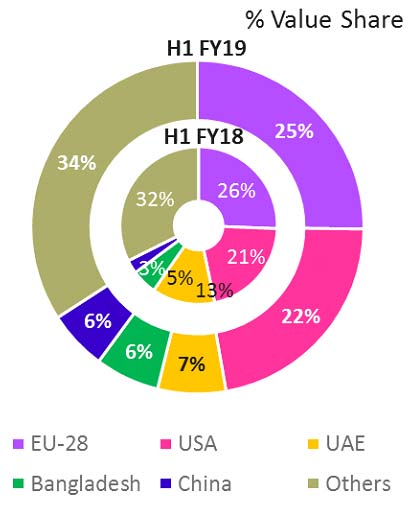
The overall T&A exports in H1 FY19 stood at US$ 18.4 billion, showing a decline of 1% from the previous year. Export of all the categories except apparel have grown in H1 FY19 as compared to H1 FY18. Apparel exports saw a decline of 16% this half year. This is largely attributed to the decline in apparel exports to UAE, which have dropped inexplicably by 55% during H1 FY19. India’s overall T&A exports to UAE also declined by ~50% during first half of FY19. EU, USA and UAE remain the top export destinations for India’s T&A products.
Table 1: India’s Textile & Apparel Exports (US$ mn.)
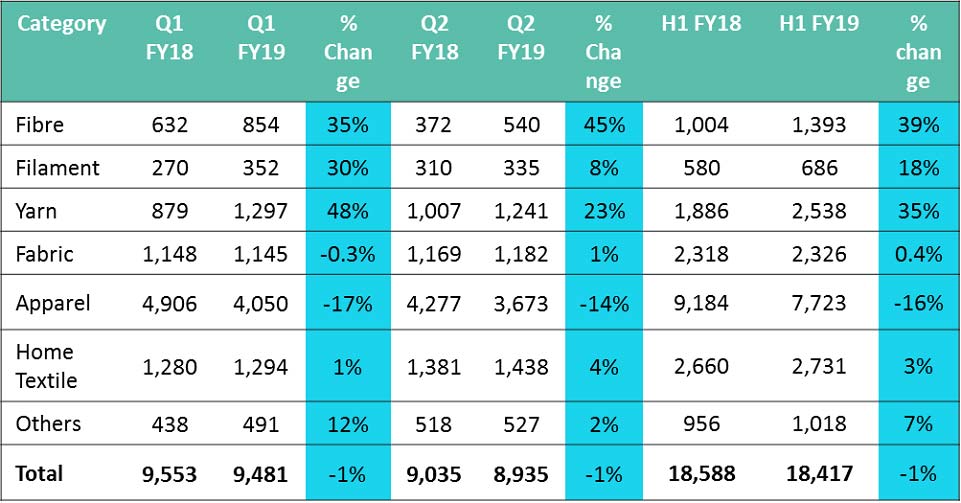
Figure 1: India’s top T&A export markets
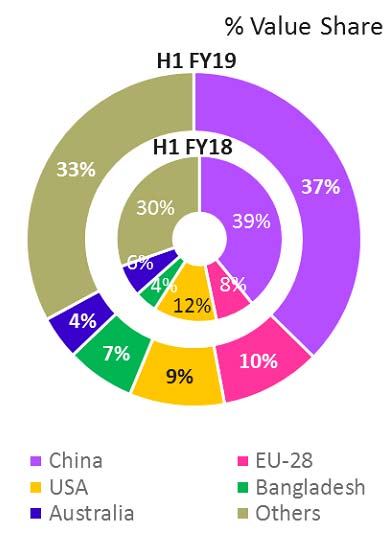
India’s T&A imports have increased by 4% in H1 FY19 as compared to the previous year. Import of all categories except fibre have increased in H1 FY19. Apparel imports increased sharply by 56%, primarily due to the impact of reduced effective import duties post GST for imports from countries like China and Bangladesh. China continues to be the largest import partner for India, however, the imports declined marginally by 0.4% in H1 FY19 as compared to the previous year.
Table 21: India’s Textile & Apparel Imports (US$ mn.)
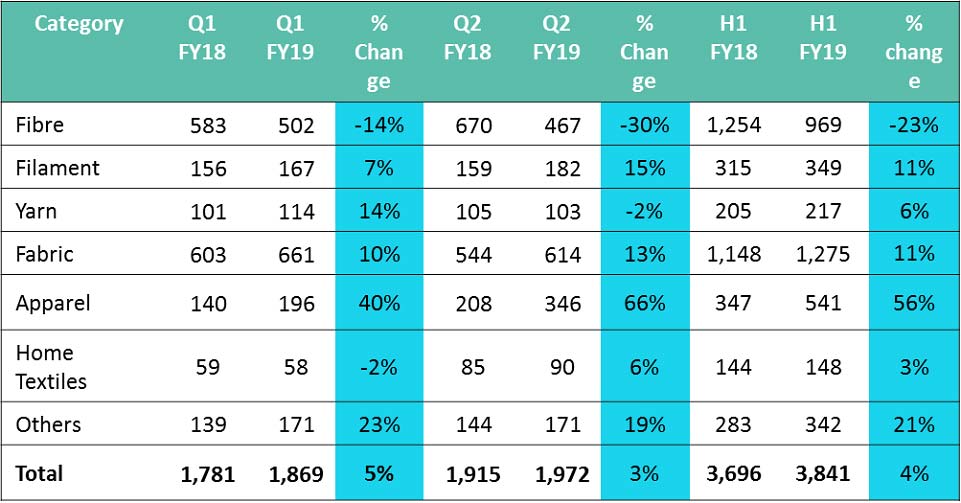
Figure 2: India’s top T&A import markets
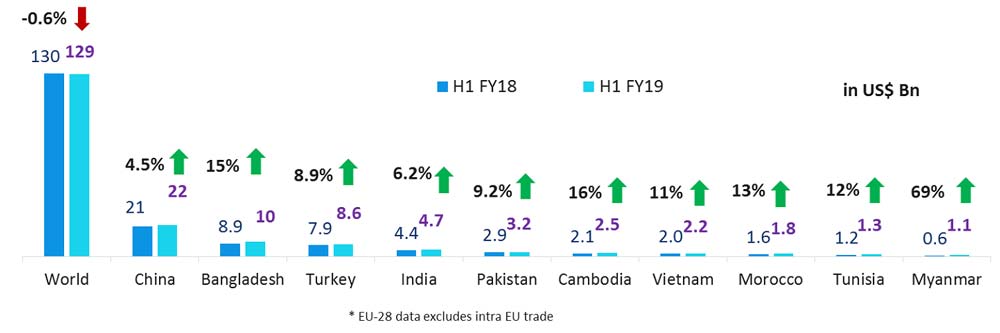
USA imported textile and apparel products worth US$ 58 billion in H1 FY19, growing by 4% as compared to the same period in the previous year. India’s T&A exports to USA increased by 5.2% in H1 FY19. Overall imports of EU, pegged at US$ 129 billion in H1 FY19 witnessed y-o-y marginal decline of 0.6%. China is the largest import partner for USA and EU both. India’s T&A exports to EU increased by 6.2% in H1 FY19.
Figure 3: Overall imports and top import countries of USA
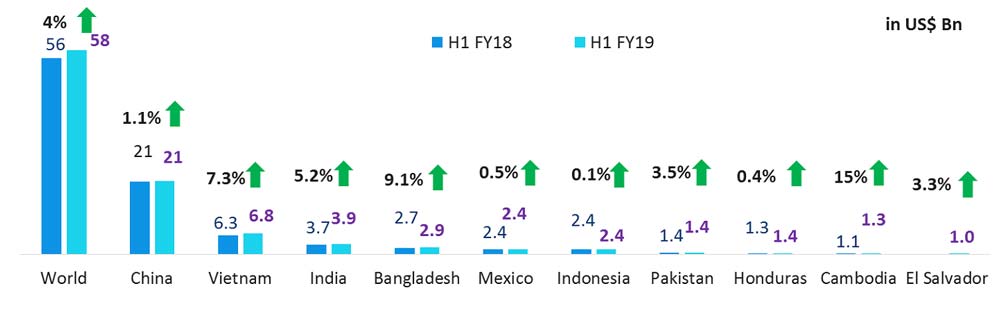
Figure 4: Overall imports and top import countries of EU-28*
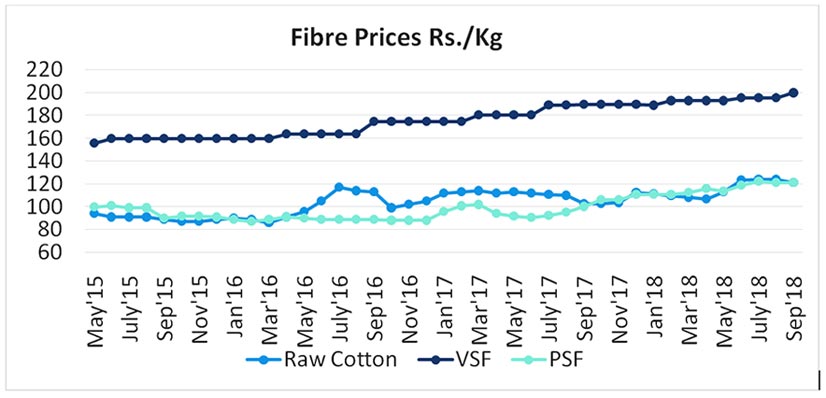
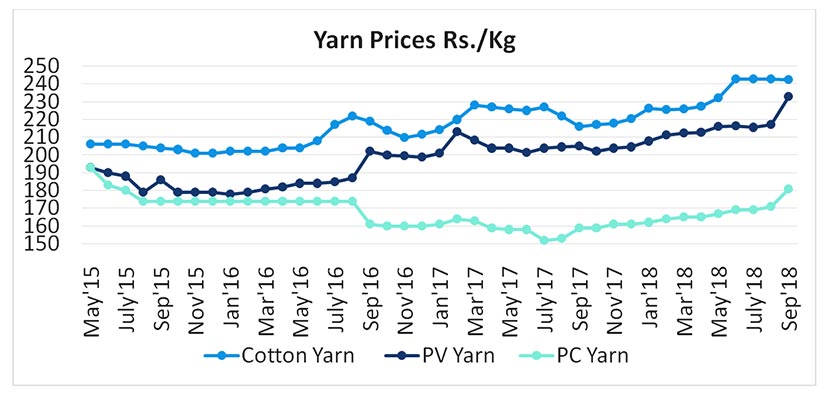
Overall, there was an increase in raw material prices in H1 FY19 compared to H1 FY18. On average, raw cotton, viscose staple fibre and polyester staple fibre prices increased by 8%, 6% and 26%, respectively, in H1 FY19. Similarly, there was an increase in the average prices of cotton yarn, polyester viscose blended yarn and polyester cotton blended yarn, growing at a rate of 6%, 7% and 9%, respectively, in H1 FY19.
Indian textile and apparel industry exhibited double-digit growth in overall sales and EBITDA levels during the first half of the financial year 2018-19. However, trade performance was not encouraging during this period. Although improvement was seen in the month of June, July and August, with total T&A exports increasing (compared month on month), September month witnessed a steep decline of 18% in overall T&A exports, apparel declining highest among all categories. It can be anticipated that apparel exports are likely to remain subdued in near future. Hence, it would not be wrong to say that the textile industry is in dire need of undertaking the necessary steps to revive T&A exports.
The article has been authored by B. Prakash, Associate Director, Soumya Gupta, Associate Consultant and Swati Jain, Research Analyst.
It was published in December 2018 in Fibre2Fashion.