

Overall sales of top companies have increased marginally, while EBITDA margin has declined significantly for FY18
In continuation of Wazir’ Textile sector performance update, discussed below is the Wazir Textile Index (WTI) comprising cumulative financial performance of the top ten Indian textile companies along with update on market performance of Indian textile sector for FY18.
Based on detailed financial analysis, WTI Sales was calculated to be 110.5 in FY18 as compared to 107.9 in FY17 which indicates that the overall consolidated sales increased by 2% in this year.
Figure 1: WTI Sales
Figure 2: WTI EBITDA
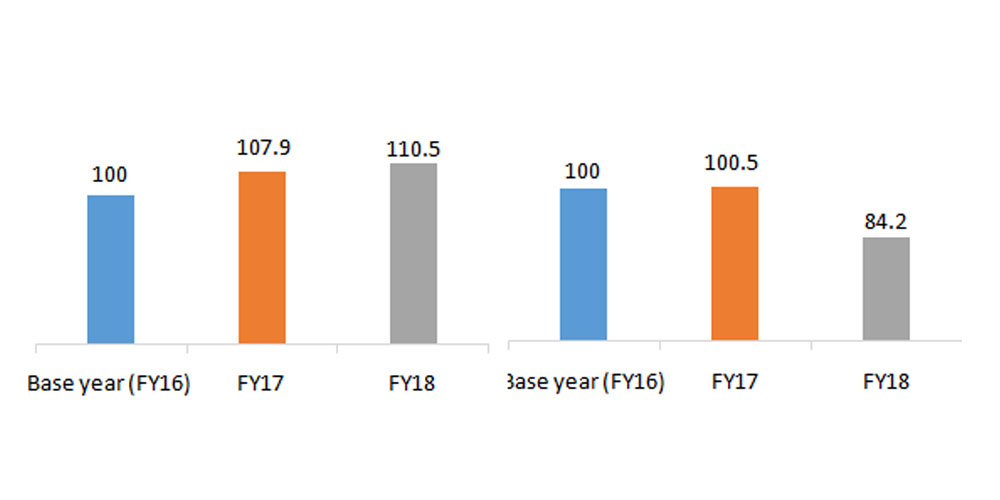
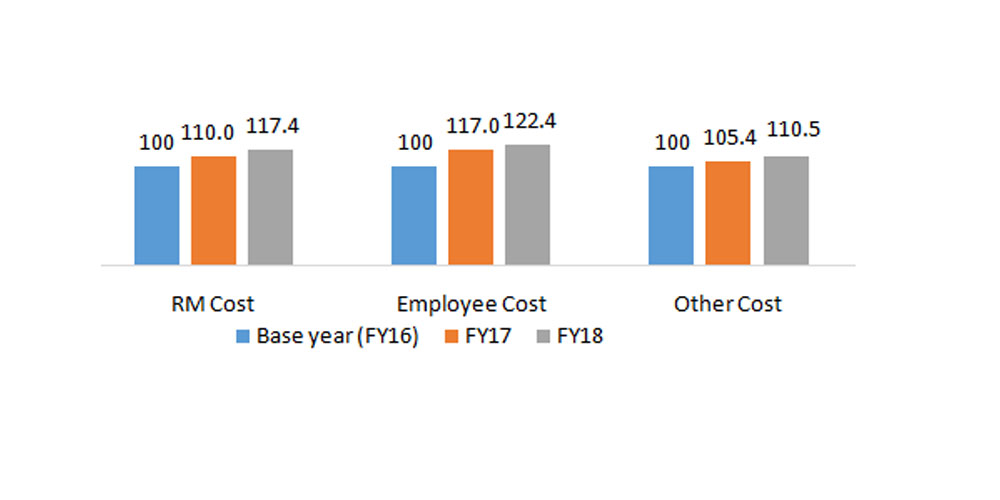
However, EBITDA declined drastically by 16% in the same period. Consolidated WTI EBITDA stood at 84.2 in FY18 as compared to 100.5 in FY17. Post GST, even though overall sales has grown in volume but the demand constraints have resulted in lower price realization leading to reduced EBITDA margins. Also, there has been an increase in raw material cost and employee cost during this period which impacted the EBITDA margins.
Figure 3: WTI Cost
Immediately Post GST there was a dip in consolidated sales, however in Q4 & Q3 the sales and EBITDA levels have improved for the textile industry. On consolidated level, sales increased by 4% in Q4 vs Q3 FY18 & 3% in Q3 vs Q2 FY18, after a dip of 0.5% in Q2 vs Q1 FY18. Compared to previous year, sales increased by 0.3% in Q4 FY18 vs Q4 FY17 & 7% in Q3 FY18 vs Q3 FY17, after a decrease of 2% in Q2 FY18 vs Q2 FY17.
Figure 4: Quarterly Consolidated Sales – Rs. Cr
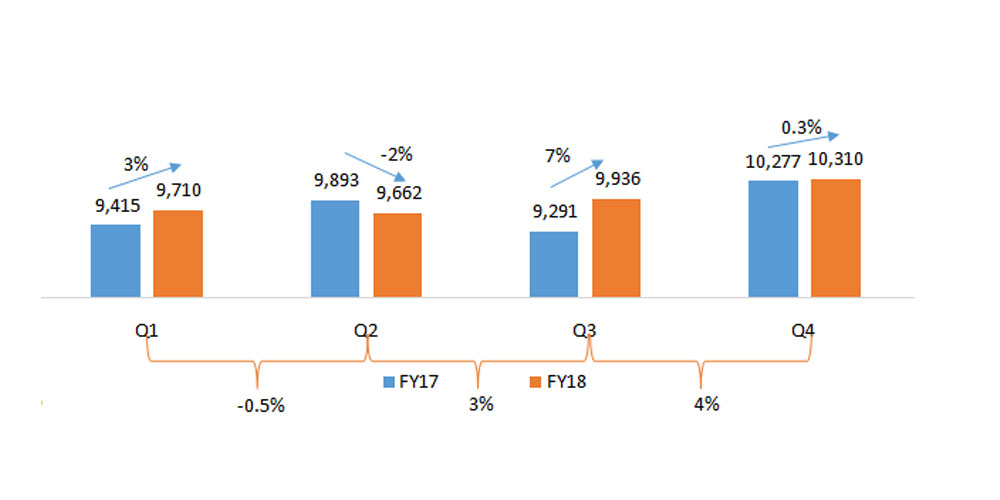
Source: Moneycontrol
Consolidated EBITDA margins declined consistently in Q1 FY18, Q2 FY18, Q3 FY18 & Q4 FY18 compared to previous year. However the decline was less in Q3 FY18 at around -3 percentage points while the decline in Q4 FY18 was the least at around -1 percentage point. Within FY18, average EBITDA margins declined in Q2 to 12.4% and then further rebound in Q3 & Q4 to reach 13.7% in Q4 FY18.
Figure 5: Quarterly Average EBITDA%
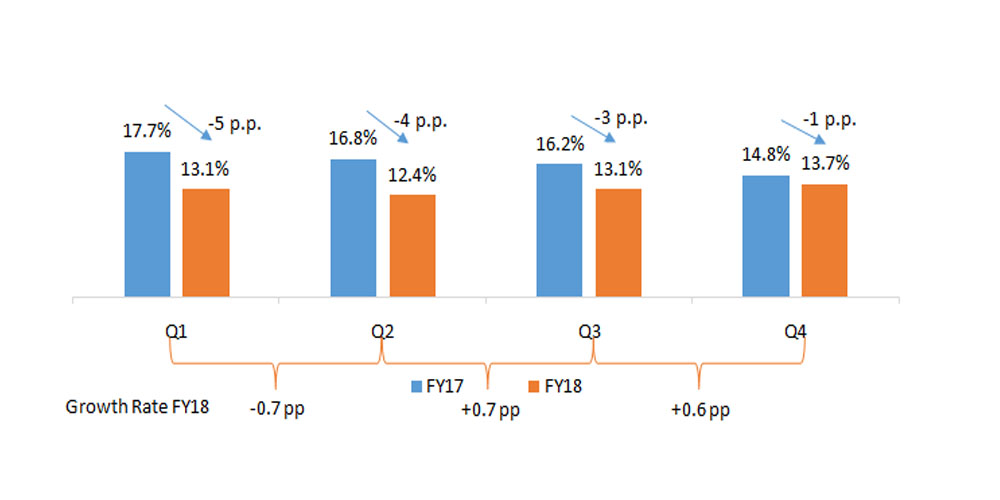
Source: Moneycontrol
India’s Economy revived in Q4 FY18 but Industrial Production for Textiles & Apparel declined in FY18
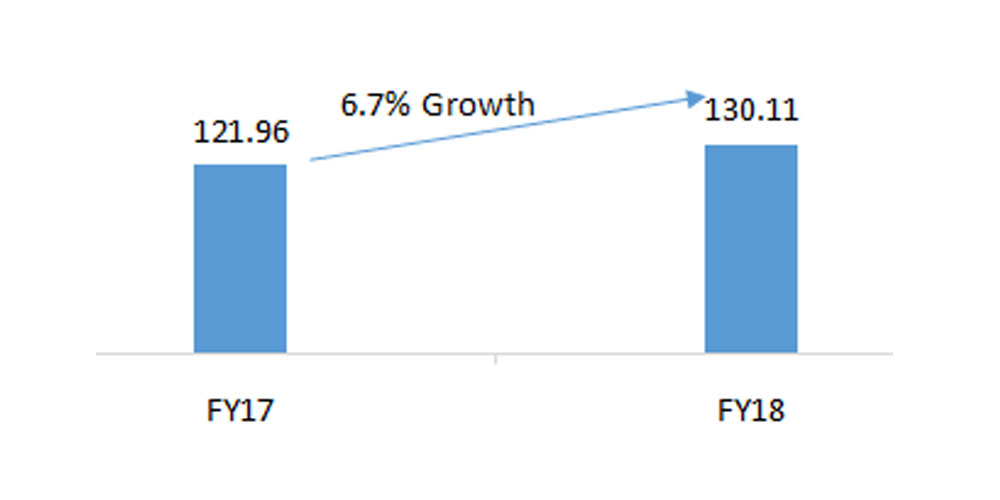
India’s real GDP has grown by 6.7% in FY18 as compared to FY17. This growth is attributed to the high GDP growth of 7.7% in Q4 FY18
Figure 6: India’s GDP at constant prices*(Rs. Lakh Cr.)
Source: Reserve Bank of India
*Base Year
Source: Reserve Bank of India
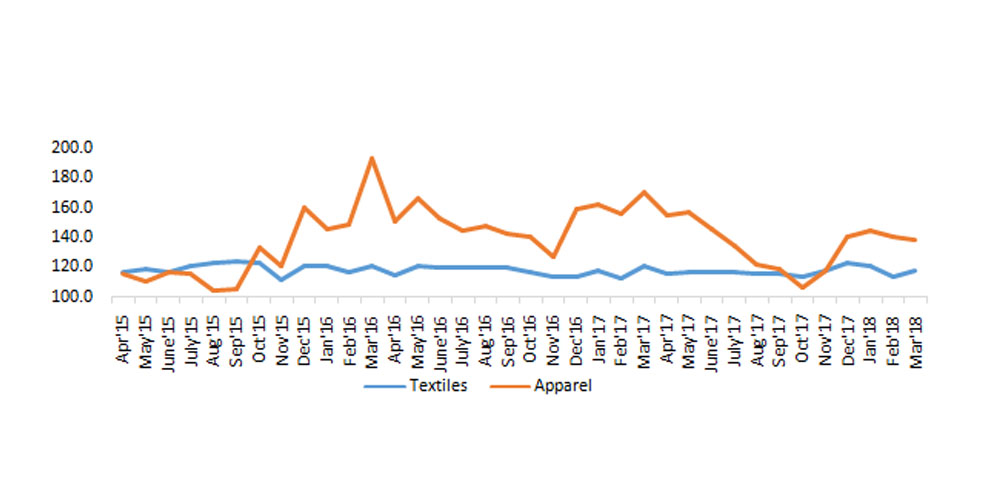
Average IIP (Index of Industrial Production) for textiles has declined by 0.5% while IIP for apparel has declined by 11% in FY18 as compared to FY17. Decreased IIP may be attributed to lower market demand immediately after GST introduction, especially for apparel which saw significant decline in production post GST.
Figure 6: India’s GDP at constant prices*(Rs. Lakh Cr.)
Due to increase in raw material prices, average WPI for textiles has shown an increase of 2% in FY18 as compared to FY17.
Figure 8: Wholesale Price Index (WPI*)
Source: Reserve Bank of India
*Base Year
Source: Reserve Bank of India
Indian exports of T&A products saw marginal growth in FY18
Indian exports of T&A (Textile and Apparel) products stood at US$ 37 Billion in FY18, increasing by 0.6% as compared to last year.
Table 1: India’s Textile & Apparel Exports (US$ mn)
| Apparel | 8,464 | 9,183 | 8% | 8,924 | 7,533 | -16% | 17,388 | 16,716 | -4% |
|---|---|---|---|---|---|---|---|---|---|
| Fabric | 2,278 | 2,316 | 2% | 2,243 | 2,268 | 1% | 4,521 | 4,584 | 1% |
| Fibre | 720 | 1,002 | 39% | 1,781 | 1,790 | 1% | 2,501 | 2,792 | 12% |
| Filament | 530 | 580 | 9% | 576 | 651 | 13% | 1,106 | 1,231 | 11% |
| Home Textiles | 2,536 | 2,659 | 5% | 2,584 | 2,528 | -2% | 5,120 | 5,187 | 1% |
| Yarn | 1,886 | 1,886 | 2% | 2,274 | 2,383 | 5% | 4,131 | 4,269 | 3% |
| Others | 828 | 955 | 15% | 881 | 968 | 10% | 1,710 | 1,923 | 12% |
| Total | 17,214 | 18,581 | 8% | 19,263 | 18,122 | -6% | 36,477 | 36,703 | 0.6% |
Source: DGCI&S
Export of all the categories have grown in FY18 as compared to FY17 except apparel. India’s apparel exports increased by 8% y-o-y in H1 FY18, however the same declined by 16% in H2 FY18, resulting in an overall decline in apparel exports by 4% in FY18. Post GST issues like reduction in duty drawback, slow refund of input credit etc. had significant impact in apparel exports reduction. Fibre exports grew significantly at a rate of 12% in FY18 driven by cotton fibre exports growth of ~14%. Fibre exports slowed in H2 after a robust H1, while yarn exports have shown a reverse trend. It is worth mentioning that, India’s overall exports grew 10% y-o-y in FY18, compared to only 0.6% for the T&A sector.
Table 2: India’s Top Export Markets
| Country | FY17 | FY18 |
| USA | 21% | 21% |
| UAE | 13% | 9% |
| UK | 6% | 6% |
| Bangladesh | 6% | 6% |
| Germany | 5% | 5% |
| Others | 50% | 53% |
Source: DGCI&S
USA and UAE continue to be the two largest export markets with a cumulative share of ~30%.
India’s imports of T&A products are on a rise post introduction of GST
India imported Textile and Apparel products worth US$ 7 Billion in FY18, registering a growth of 16% as compared to FY17.
Table 3: India’s Textile & Apparel Imports (US$ mn)
| Apparel | 308 | 347 | 13% | 287 | 425 | 48% | 595 | 773 | 30% |
| Fabric | 946 | 1,147 | 21% | 888 | 1,134 | 34% | 1,834 | 2,336 | 27% |
| Fibre | 1,111 | 1,254 | 13% | 809 | 696 | -14% | 1,920 | 1,950 | 2% |
| Filament | 281 | 314 | 12% | 272 | 324 | 19% | 553 | 639 | 16% |
| Home Textiles | 139 | 144 | 4% | 122 | 151 | 24% | 260 | 295 | 13% |
| Yarn | 179 | 205 | 15% | 153 | 228 | 49% | 332 | 433 | 31% |
| Others | 272 | 283 | 4% | 279 | 324 | 16% | 551 | 607 | 10% |
| Total | 3,236 | 3,695 | 14% | 2,810 | 3,336 | 19% | 6,045 | 7,032 | 16% |
|---|
Source: DGCI&S
Import of all categories have increased in FY18. Yarn imports have increased maximum in FY18 (31%) as compared to other categories. Increase in imports of spun yarn led to this increase in yarn imports in FY18. Apparel and fabric imports have also grown significantly by 30% and 27% in FY18, especially post GST at 48% and 34% respectively. One of the reasons for this increase in apparel and fabric imports is reduced effective import duty with removal of CVD and credit available for IGST.
Table 4: India’s Top Import Markets
| Country | FY17 | FY18 |
| China | 38% | 41% |
| Bangladesh | 8% | 6% |
| Australia | 7% | 5% |
| Vietnam | 3% | 4% |
| Others | 37% | 36% |
| Others | 50% | 53% |
Source: DGCI&S
China continues to be the largest import partner for India. Import share of USA has increased significantly from 7% in FY17 to 9% in FY18, primarily due to increase in cotton imports.
T&A Imports of US and EU has increased in FY18 till date
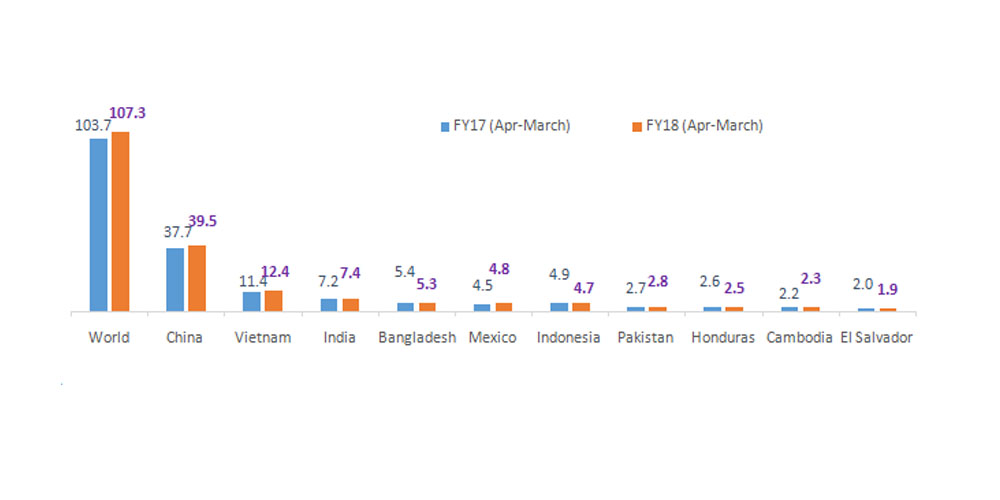
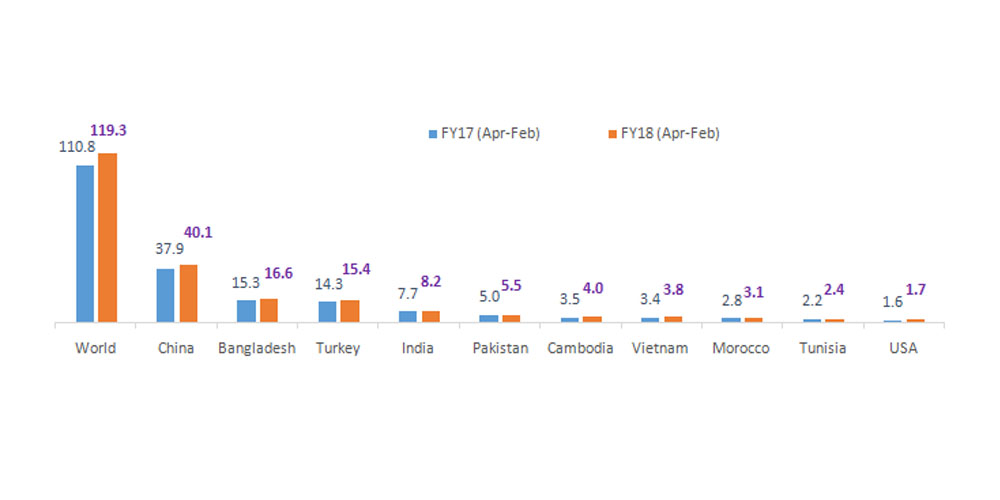
US imports of T&A have increased by 4% in FY18, while EU imports of T&A increased by 8% during April 2017 to February 2018.
Amongst the top import countries, Vietnam has shown high growth of 8% in US imports, while China and India has increased by 5% and 2% respectively. Interestingly US imports from Bangladesh have declined by 3% during this period.
Figure 9: Overall Imports and Top Import Countries of USA (US$ Bn)
Source: OTEXA
Cambodia has shown the highest growth of 15% in imports of EU. Other top countries to EU include Pakistan (11%), Vietnam (10%), Morocco (10%) and Bangladesh (8%). India and China have both shown growth of 6% in EU imports.
Figure 10: Overall Imports and Top Import Countries of EU-28* (US$ Bn)
Source: EUROSTAT
EU-28 data excludes intra EU
EU trade
Despite fluctuations, average raw material prices increased in FY18 (except for PC yarn)
Overall there was an increase in raw material prices in FY18 compared to FY17. On an average basis, raw cotton, viscose staple fibre and polyester staple fibre prices increased by 2%, 10% and 11% respectively in FY18.
Figure 11: Fibre Prices (Rs. /kg)
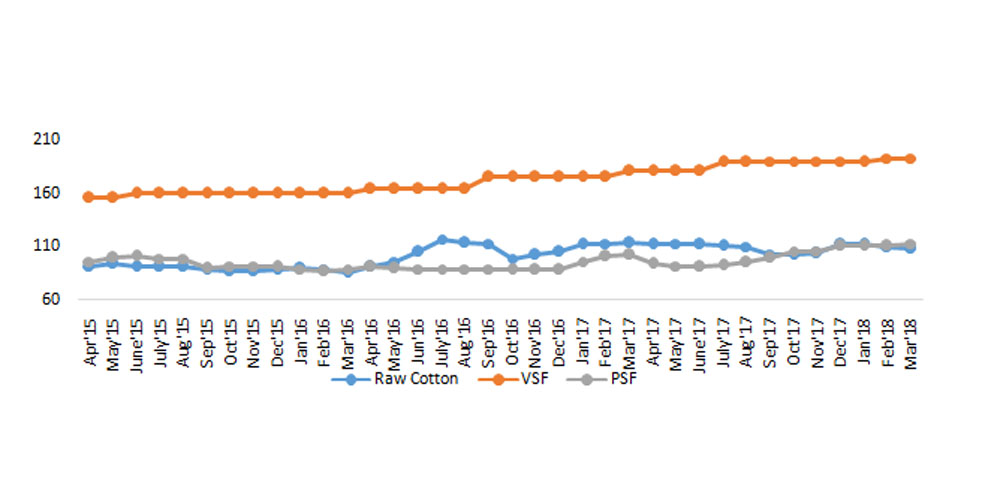
Source: Ministry of Textiles
Similarly there was an increase in cotton yarn and polyester viscose blended yarn average prices growing at a rate of 4% & 5% respectively in FY18. However, polyester cotton blended yarn registered a decline of 4% in FY18 as compared to FY17.
Figure 12: Yarn Prices (Rs. /kg)
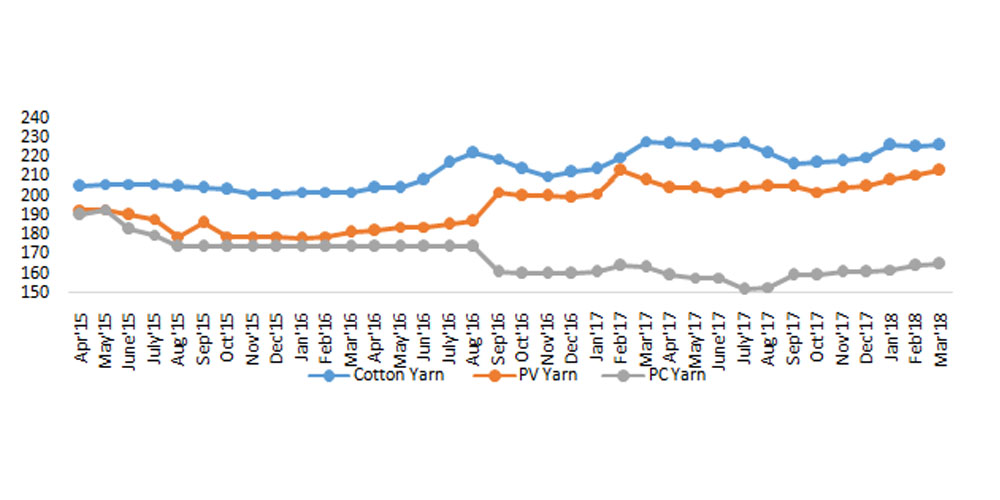
Source: Ministry of Textiles
Overall Indian textile and apparel industry has struggled in terms of profitability in FY18 due to the lingering effect of GST. However, the overall performance of the industry has rebounded in the last quarter of FY18 which is promising for the future. The decline in EBITDA margins for the top ten textile companies was the least in Q4 FY18 as compared to the previous quarters. T&A Exports have grown at a slow rate with a decline in apparel exports in FY18. Post GST issues like reduction in duty drawback, slow refund of input credit etc. and increasing competition from other low cost nations had significant impact in apparel exports reduction. Also India’s T&A imports are on a rising trend especially post GST. One of the reasons is reduced effective import duty with removal of CVD and credit available for IGST. This needs to be addressed immediately to restrict further impact on domestic industry.
The article has been authored by B. Prakash, Associate Director and Soumya Gupta, Associate Consultant.
It was published in July 2018 in Tecoya Trend.